Trading Strategies for the Descending Channel Pattern
Every pattern demands its own approach. Here are some strategies that will help you profit when trading the Descending Channel Pattern: choose the ones that suit you, your goals and your trading style.
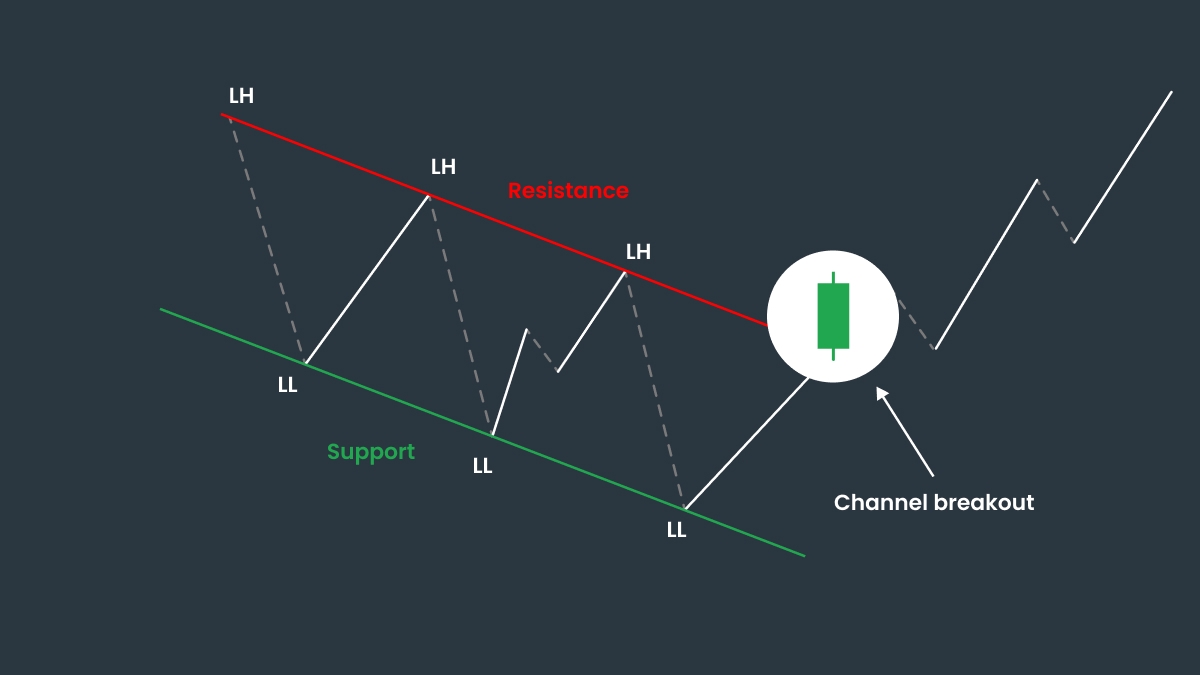
1. Breakout Strategy (Bullish Reversal)
When the price finally breaks out above the upper resistance line, especially with strong momentum or high volume, it often signals the end of a downtrend and the start of new upward momentum.
This is a potential bullish reversal and a great chance to enter a long position.
Here’s how to trade on it:
Entry: wait for a clear candle close above the upper resistance. Don’t rush in during a breakout candle, let it close to confirm the move.
Stop-loss: place it just below the last swing low or below the lower channel line to protect yourself against false breakouts.
Target: measure the height of the channel (distance between support and resistance) and project that distance upward from the breakout point.
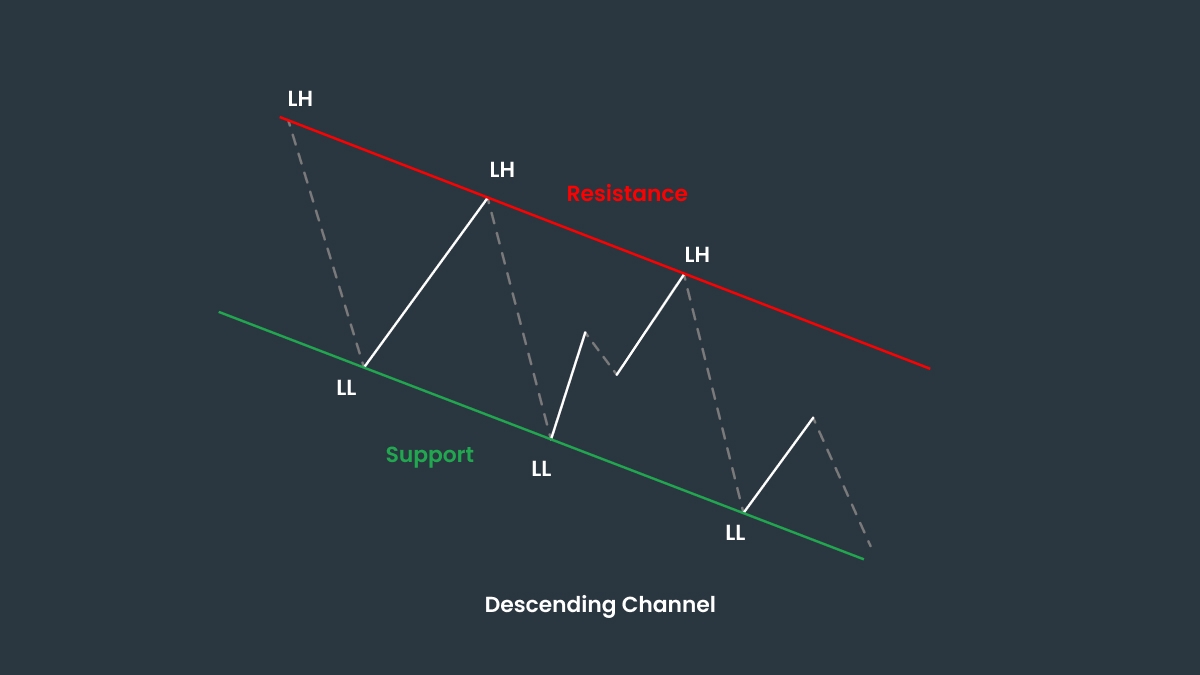
2. Range-Bound Strategy (Trading Within the Channel)
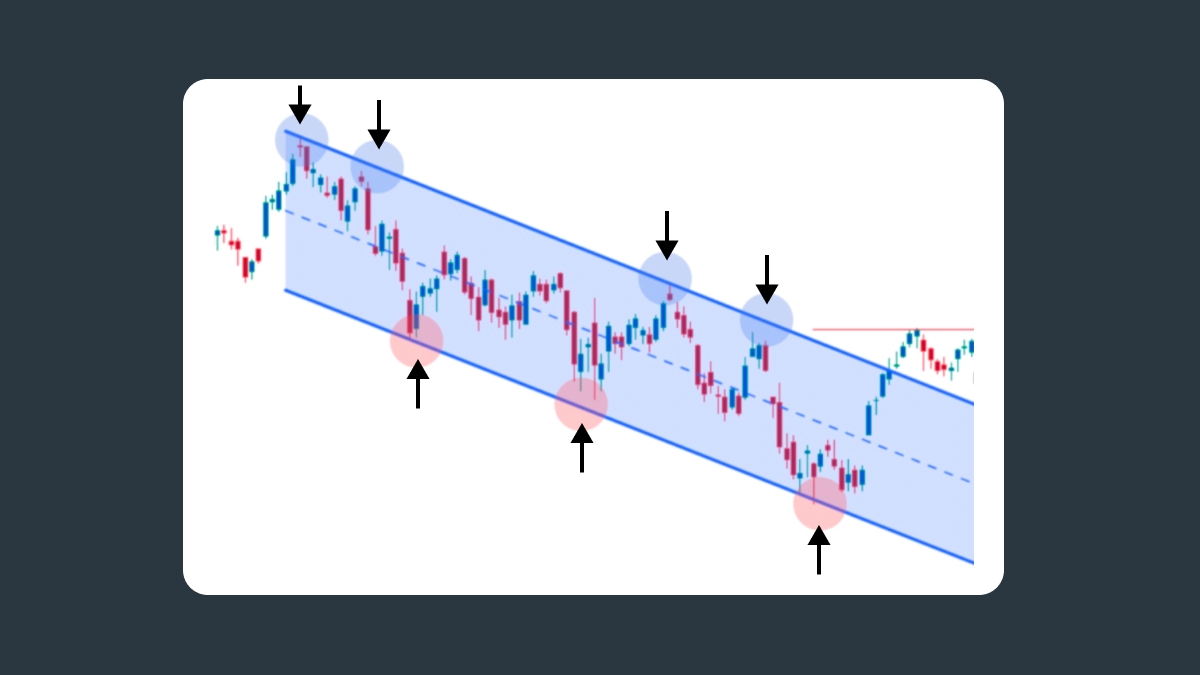
Not every trader is waiting for a breakout, some traders choose to trade within the trend, opting for a more predictable and less risky scenario. The price in the Descending Channel tends to bounce between the resistance and support lines, offering multiple chances to enter short near the top and go long near the bottom. In this case the Third Touch Strategy is a good option.
How to determine the entry point:
First touch: the price hits either the support or resistance line but may bounce back.
Second touch: the price tests the same level again but with less momentum.
Third touch: the price hits the level once more, and this time, the move has a higher probability of either reversing or breaking through.
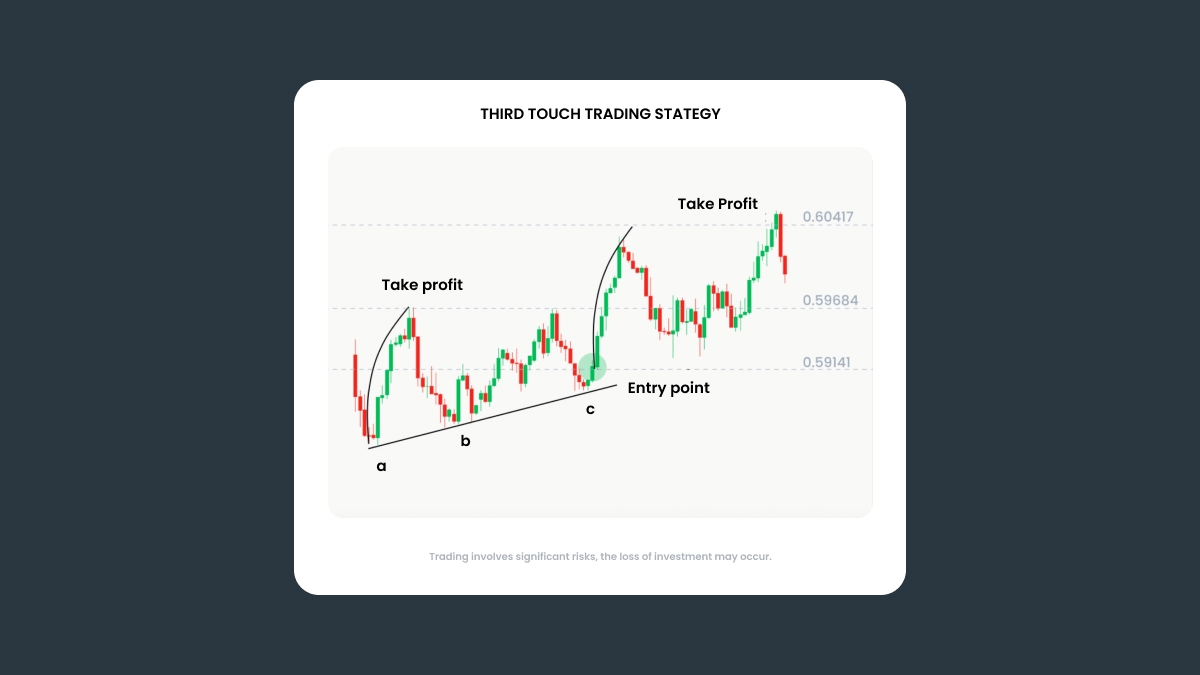
To set a take-profit order, target the opposite boundary of the channel. This gives you a reasonable target based on previous price behavior.
As for the stop-loss, place it a few pips below the support line or the most recent low.
To learn more about this method, read this article: “The Third Touch Trading Strategy”.
3. Bearish continuation breakdown strategy
Most Descending Channels continue in the direction of the existing downtrend. A strong bearish continuation setup forms when the price breaks below the lower support line.
Entry: Wait for a clear candle close under the channel’s lower boundary, ideally confirmed by rising volume or momentum indicators.
Stop-loss: Place it just above the last minor high inside the channel, or above the broken support line, to protect against false breaks.
Target: Measure your Channel’s height and project it downward from the breakdown point, or use the next major horizontal support as your profit objective.
This approach takes advantage of the trend’s strength, but requires discipline: false breakdowns can trap early sellers, so always wait for confirmation before entering.
4. False breakouts and retests
Not every breakout from a Descending Channel follows through right away. False or premature breakouts are common, with the price spiking outside the channel only to fall back inside.
A practical way to manage this is to wait for a retest before entering:
If the price breaks out above the channel, wait for a pullback that confirms the old resistance as new support before entering long.
If the price breaks down below the channel, wait for a pullback toward the broken support; if it holds as resistance, a short entry is safer.
Invalidation: If the price re-enters and closes back inside the channel, consider the breakout failed and step aside.
This retest plan helps filter out fakeouts and provides a clear level for stops and invalidation, reducing the risk of being trapped.
Case studies: how to trade on a Descending Channel
Example 1 — bearish continuation breakdown
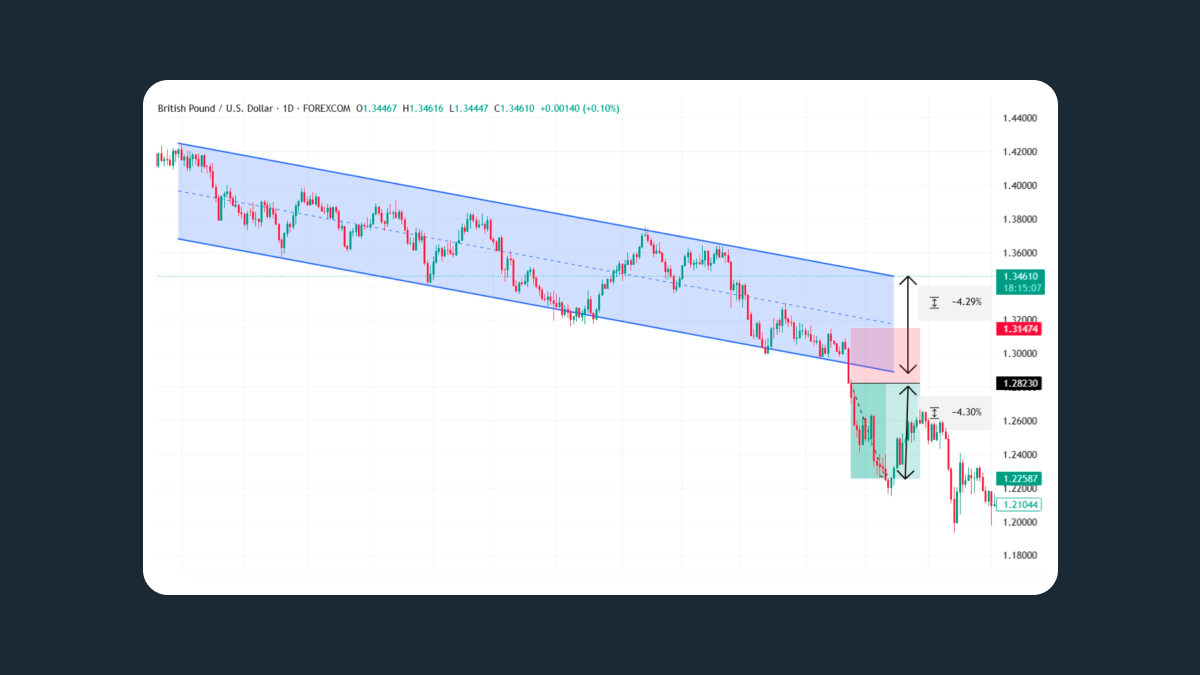
On this GBPUSD daily chart, the price traded inside a Descending Channel for months.
Entry: After the price closes below the channel’s lower boundary.
Stop-loss: Just above the last high
Target: Equal to the channel’s height (around a 4.3% move).
Result: A clean bearish continuation, textbook breakdown
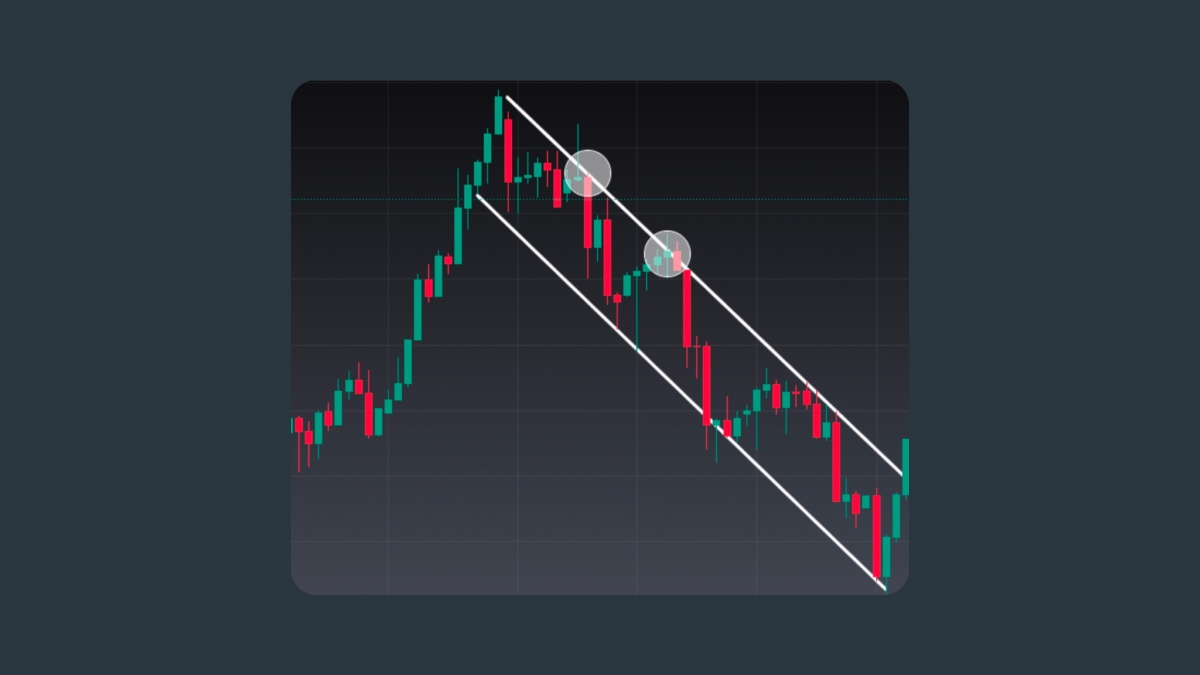
Example 2 — re-entry trade inside the Channel
On this USDCHF 4H chart, the price briefly spikes above the channel’s resistance level before dropping back inside.
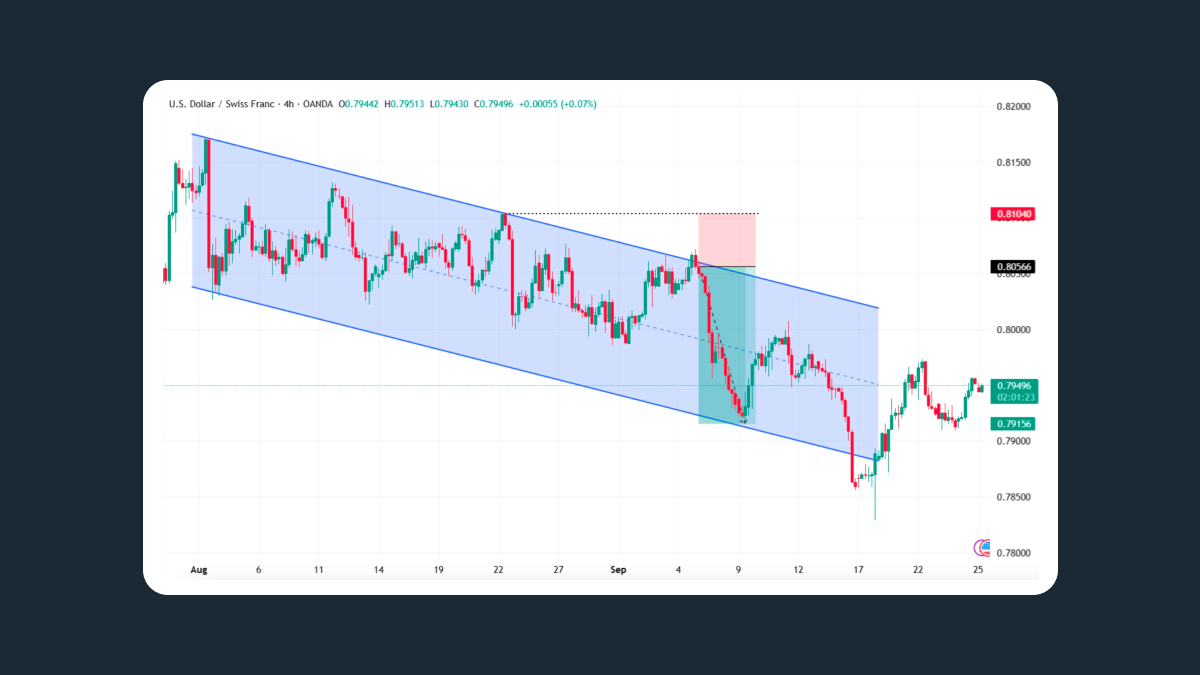
Entry: After the candle closes back inside the channel (false breakout).
Stop-loss: Just above the last time the upper boundary was touched (~0.8104).
Target: The lower boundary, near 0.7915.
Result: A clean short with a logical stop. The trade rides the move from re-entry at the resistance level down to support.
Indicator confluence and volume confirmation
A Descending Channel becomes much more reliable when price movement lines up with what indicators are showing. Combining indicators and volume data can give you a better sense of the pattern's reliability.
1. Volume confirmation
Volume shows how much conviction the market has. When the price breaks out of a Descending Channel, check the volume bar. Rising volume during a breakout adds credibility. It means more traders are participating, which often confirms the move. Low or falling volume suggests a weak breakout that might fail soon. Inside the channel, volume often shrinks as price consolidates, then expands once a new trend begins. In short, volume expansion is a green light, and volume collapse is a warning sign.
2. RSI and momentum alignment
Momentum indicators like the RSI or Stochastic Oscillator help you see if price movement supports what the chart shows. When RSI dips into oversold territory near the lower channel boundary, it can be a hint that sellers are losing strength and a bounce is possible. If RSI is overbought, it can be a warning that a new swing down may be coming. On a breakout above resistance, look for RSI crossing above 50 or the Stochastic lines turning upward together. That alignment can confirm a real shift in momentum.
3. Divergence
Divergence between price and momentum is another clue. Bullish divergence happens when price makes lower lows, but the RSI or MACD makes higher lows. That can signal weakening downside pressure and a possible bullish reversal. Bearish divergence is the opposite: the price makes higher highs, but the indicator doesn’t confirm it. This often precedes a failed breakout or deeper drop.
4. MACD and volume synergy
The MACD indicator works well with volume analysis. When both MACD histogram bars and volume rise together during a breakout, it suggests strong participation and sustained direction. If the MACD crosses above its signal line right as volume spikes, the odds of a successful breakout improve.
5. Combining signals
A clean setup often includes several confirmations:
- Breakout above resistance
- Volume spike
- RSI crossing above 50
- MACD turning positive
When at least two or three of these align, the trade setup gains reliability. If they don’t, it can be better to wait. Strong confluence between indicators and price action ensures more high-probability trades and less guessing. The best setups are the ones that don’t need to be forced. If indicators disagree with what the price is showing, just sit it out. There will always be another clearer opportunity.
Multi-timeframe context
You can spot Descending Channels on any chart, but they become more meaningful when they match what’s happening on higher timeframes. Start your analysis from the top before working your way down to lower timeframes.
1. Check the higher timeframe (daily or 4H chart)
This is to find the dominant trend. If the higher chart is clearly bearish, a Descending Channel on the lower timeframe (like 1H or 15-minute) will often act as a continuation pattern.
2. Move to your trading timeframe
Once you know the bigger trend, look for a Descending Channel forming within it. When you trade in the same direction as the higher-timeframe trend, your setups usually have fewer false signals and a more likely to work.
3. Refine entries on lower timeframes
When price gets close to the channel line or starts breaking out, zoom in to a lower timeframe to refine your entry. For example, if you spot a breakout on the 1H chart, you can drop to the 15-minute one to find a cleaner entry.
4. Watch for counter-trend channels
Sometimes, a Descending Channel on a lower timeframe moves against the broader trend. In that case, it’s often just a pullback within the higher-timeframe uptrend rather than a true bearish continuation. These counter-trend channels can offer buying opportunities if the larger trend is still strong.
This top-down approach keeps you trading with the flow of the broader market instead of against it. A channel that aligns across multiple timeframes carries more weight, while one that runs opposite to the main trend may simply mark a short-term correction.
Risk management for channel trades
No matter how good the pattern looks, a Descending Channel can still trap traders with fakeouts and sudden spikes.